Building A Powerful Earnings Surprise Radar with Python
- Nikhil Adithyan

- May 16
- 8 min read
A step-by-step tutorial

Introduction: Why Earnings Season Needs a Radar
Earnings season can get noisy very quickly.
Hundreds of companies report within a short window, and not every report deserves the same level of attention. For a financial media team, that creates a coverage problem. For a fintech product, it creates a prioritization problem. For traders and developers, it creates a watchlist problem.
Instead of scanning a large earnings calendar manually, we can build a simple radar that narrows the list down to the earnings events worth checking first.
In this tutorial, we’ll build a Python script that scans the S&P 500, finds upcoming earnings events, adds recent price behavior, and ranks the top 10 stocks based on a simple radar score.
This is not an earnings prediction model. It does not tell us which companies will beat or miss expectations. It only helps answer a more practical question: Which upcoming earnings reports deserve attention first?
What We’re Building and the Data We’ll Use
We’re building a simple Earnings Surprise Radar in Python.
The script will scan the S&P 500, find companies with upcoming earnings, calculate recent price movement, and return the top 10 names worth watching.
The final output will look like this:

We’ll use three EODHD data inputs for this:
S&P 500 components from the fundamentals endpoint with filter=Components
Upcoming earnings events from the Earnings Calendar API
Historical EOD prices to calculate 30-day return and volatility
The score itself stays simple. A stock ranks higher when its earnings date is closer, recent volatility is higher, and the stock has already made a larger move heading into earnings. EPS estimate is kept in the output as useful context, but it is not part of the score because most of the candidates already have estimates available.
Import Packages and Set the Date Windows
We’ll keep the setup minimal. The script only needs packages for API requests, table handling, numerical calculations, and date ranges.
import requests
import pandas as pd
import numpy as np
from datetime import date, timedelta
Next, set the API key and define the two windows we need.
api_key = 'YOUR EODHD API KEY'

today = date.today()

earnings_window_days = 30
price_lookback_days = 60

earnings_start = today
earnings_end = today + timedelta(days=earnings_window_days)

price_start = today - timedelta(days=price_lookback_days)
price_end = today
Note: Replace YOUR EODHD API KEY with your actual EODHD API key. If you don’t have one, you can obtain it by opening an EODHD developer account.
Get the S&P 500 Stock Universe
Instead of manually maintaining a list of S&P 500 tickers, we’ll pull the index components directly from EODHD.
components_url = f'https://eodhd.com/api/fundamentals/GSPC.INDX?api_token={api_key}&fmt=json&filter=Components'

components_response = requests.get(components_url)
components_data = components_response.json()

sp500 = pd.DataFrame.from_dict(components_data, orient='index')

sp500.head()
This returns the current S&P 500 components with fields like Code, Exchange, Name, Sector, Industry, and Weight.
Now we’ll clean the table and create EODHD-compatible tickers. EODHD stock tickers use the format AAPL.US, so we combine the stock code with the exchange.
sp500 = sp500.copy()

sp500['Code'] = sp500['Code'].astype(str).str.strip()
sp500['Exchange'] = sp500['Exchange'].astype(str).str.strip()
sp500['Name'] = sp500['Name'].astype(str).str.strip()
sp500['Sector'] = sp500['Sector'].astype(str).str.strip()
sp500['Industry'] = sp500['Industry'].astype(str).str.strip()

sp500['Ticker'] = sp500['Code'] + '.' + sp500['Exchange']

sp500 = sp500[
    ['Ticker', 'Code', 'Exchange', 'Name', 'Sector', 'Industry', 'Weight']
].copy()

sp500.head()

At this point, sp500 becomes our stock universe. We’ll use Ticker for price data and Code or Ticker for matching earnings events in the next steps.
Pull Upcoming Earnings Events
Now that we have the S&P 500 universe, we can pull upcoming earnings events from EODHD’s Earnings Calendar API.
earnings_url = f'https://eodhd.com/api/calendar/earnings?api_token={api_key}&fmt=json&from={earnings_start.isoformat()}&to={earnings_end.isoformat()}'

earnings_response = requests.get(earnings_url)
earnings_data = earnings_response.json()

earnings = pd.DataFrame(earnings_data['earnings'])

earnings
The output includes global earnings events, not just S&P 500 companies:

In the next step, we’ll filter this down by matching it with the S&P 500 universe we created earlier.
Filter Earnings to S&P 500 Companies
The earnings calendar returns a broad list of global earnings events. For this radar, we only want companies that are part of the S&P 500.
We can do that by merging the earnings calendar with our S&P 500 universe.
earnings = earnings.copy()
earnings['code'] = earnings['code'].astype(str).str.strip()
earnings['report_date'] = pd.to_datetime(earnings['report_date'], errors='coerce')
earnings['date'] = pd.to_datetime(earnings['date'], errors='coerce')
earnings['estimate'] = pd.to_numeric(earnings['estimate'], errors='coerce')
sp500_earnings = earnings.merge(sp500, left_on='code', right_on='Ticker', how='inner')
sp500_earnings = sp500_earnings[['Ticker','Name','Sector','Industry','Weight','report_date','before_after_market','currency','estimate']].copy()
sp500_earnings = sp500_earnings.sort_values('report_date').reset_index(drop=True)
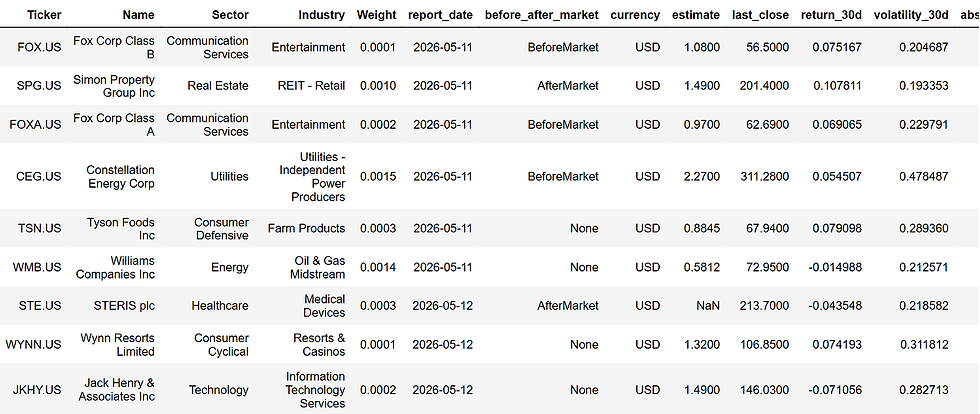
sp500_earnings
This gives us the actual candidate list for the radar:

Instead of working with thousands of earnings events, we now have a smaller set of S&P 500 companies reporting in the next 30 days. We also keep useful context like company name, sector, industry, report date, and EPS estimate.
Add Recent Price Behavior
The earnings list tells us who is reporting soon, but it does not tell us how the stock has been behaving before the report.
To add that layer, we’ll pull recent historical prices using EODHD’s historical end-of-day price endpoint for each earnings candidate and calculate two simple signals:
30-day return
30-day volatility
Fetch Recent Prices for One Ticker
First, create a helper function to fetch recent price history for one ticker.
def fetch_price_history(ticker):
    price_url = f'https://eodhd.com/api/eod/{ticker}?api_token={api_key}&fmt=json&from={price_start.isoformat()}&to={price_end.isoformat()}&period=d'

    response = requests.get(price_url)
    data = response.json()

    prices = pd.DataFrame(data)

    if prices.empty:
        return pd.DataFrame()

    prices['date'] = pd.to_datetime(prices['date'], errors='coerce')
    prices['adjusted_close'] = pd.to_numeric(prices['adjusted_close'], errors='coerce')

    prices = prices.dropna(subset=['date', 'adjusted_close'])
    prices = prices.sort_values('date').reset_index(drop=True)

    prices['Ticker'] = ticker

    return prices[['Ticker', 'date', 'adjusted_close']]
We use adjusted_close because it is better suited for return calculations after splits and dividends.
Before running this for every stock, it helps to test one ticker.
sample_ticker = sp500_earnings['Ticker'].iloc[0]
sample_prices = fetch_price_history(sample_ticker)
sample_prices.head()

Once the price data is coming through correctly, we can convert it into signals.
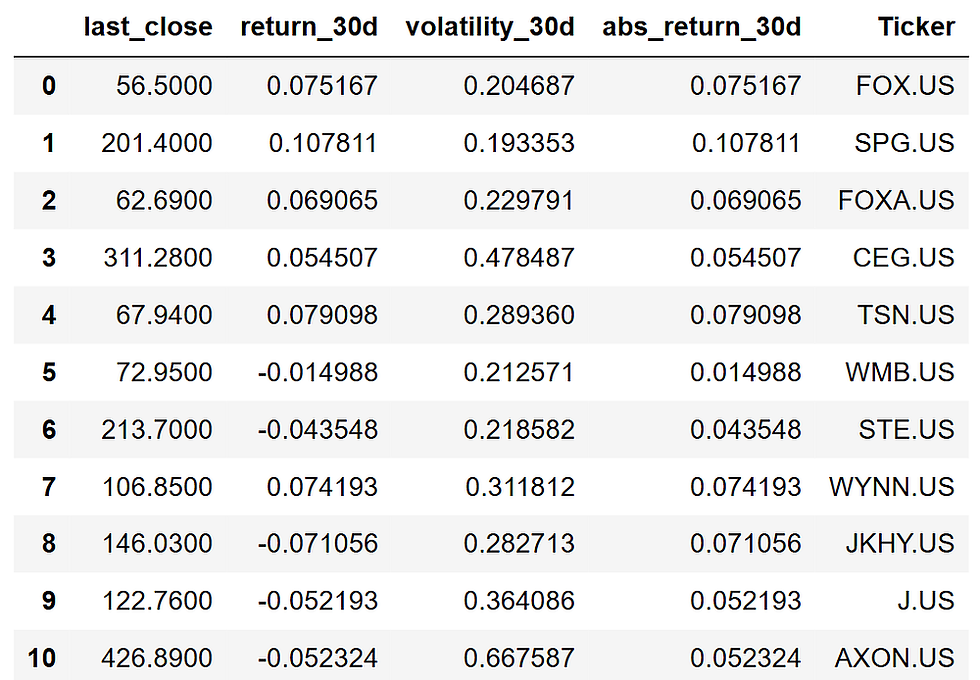
Turn Prices into Signals
For this radar, we are not trying to predict the earnings result. We only want to know whether the stock has been active heading into the report. So we’ll calculate three simple measures:
return_30d shows the direction and size of the recent move
volatility_30d shows how active or unstable the stock has been
abs_return_30d captures the size of the move regardless of direction
That last signal is useful because both rallies and selloffs can matter before earnings. A stock rising sharply into earnings and a stock falling sharply into earnings are different stories, but both can deserve attention.
def calculate_price_signals(prices):
    if prices.empty or len(prices) < 30:
        return {
            'last_close': np.nan,
            'return_30d': np.nan,
            'volatility_30d': np.nan,
            'abs_return_30d': np.nan
        }

    prices = prices.sort_values('date').copy()
    prices['daily_return'] = prices['adjusted_close'].pct_change()

    last_close = prices['adjusted_close'].iloc[-1]
    close_30d_ago = prices['adjusted_close'].iloc[-30]

    return_30d = (last_close / close_30d_ago) - 1
    volatility_30d = prices['daily_return'].tail(30).std() * np.sqrt(252)

    return {
        'last_close': last_close,
        'return_30d': return_30d,
        'volatility_30d': volatility_30d,
        'abs_return_30d': abs(return_30d)
    }
This function returns one compact set of price signals for a ticker. These signals will later become part of the radar score.
Run the Signal Calculation for All Candidates
Now we can run the same logic for every S&P 500 company that has an upcoming earnings event.
price_signal_rows = []

for ticker in sp500_earnings['Ticker'].unique():
    try:
        prices = fetch_price_history(ticker)
        signals = calculate_price_signals(prices)
        signals['Ticker'] = ticker
        price_signal_rows.append(signals)
        print(f'{ticker} DONE')

    except Exception as e:
        price_signal_rows.append({
            'Ticker': ticker,
            'last_close': np.nan,
            'return_30d': np.nan,
            'volatility_30d': np.nan,
            'abs_return_30d': np.nan
        })
        print(f'{ticker} ERROR')

price_signals = pd.DataFrame(price_signal_rows)

price_signals
The loop fetches prices for each candidate, calculates the price signals, and stores the results in one DataFrame.
The try block keeps the script from failing if one ticker has missing or unavailable price data. For a radar like this, one failed ticker should not break the full scan.
Merge Earnings and Price Signals
Finally, we merge the price signals back into the earnings candidate table.
radar = sp500_earnings.merge(
    price_signals,
    on='Ticker',
    how='left'
)

radar['report_date'] = pd.to_datetime(radar['report_date'], errors='coerce')
radar['days_to_report'] = (radar['report_date'].dt.date - today).apply(lambda x: x.days)

radar
Now radar contains both sides of the setup: the upcoming earnings event and the recent market behavior before that event. This is the table we’ll use to build the final radar score.
Build the Radar Score
Now that the radar table has both earnings dates and price signals, we can rank the candidates.
The score should stay simple. We are not trying to predict the earnings result. We only want to prioritize reports that are close, active, and already showing meaningful price movement.
For this version, the radar score uses three components:
proximity_score: higher when the earnings date is closer
volatility_score: higher when recent volatility is higher
move_score: higher when the 30-day move is larger, regardless of direction
First, we’ll create a small helper function to normalize each signal between 0 and 1.
def min_max_score(series):
    series = pd.to_numeric(series, errors='coerce')

    if series.isna().all():
        return pd.Series(0, index=series.index)

    min_val = series.min()
    max_val = series.max()

    if min_val == max_val:
        return pd.Series(0.5, index=series.index)

    return (series - min_val) / (max_val - min_val)
This lets us compare signals that are on different scales. For example, days_to_report, volatility_30d, and abs_return_30d cannot be combined directly unless we first bring them into the same scoring range.
Now we can create the component scores.
radar['proximity_score'] = 1 - min_max_score(radar['days_to_report'])
radar['volatility_score'] = min_max_score(radar['volatility_30d'])
radar['move_score'] = min_max_score(radar['abs_return_30d'])
The proximity score is reversed because fewer days to report should mean a higher score. A company reporting in 3 days should rank higher on timing than one reporting in 25 days.
Finally, we combine the components into one radar score.
radar['radar_score'] = (
    radar['proximity_score'] * 0.40 +
    radar['volatility_score'] * 0.35 +
    radar['move_score'] * 0.25
) * 100

radar['radar_score'] = radar['radar_score'].round(2)

radar[['Ticker','Name','report_date','days_to_report','return_30d','volatility_30d','radar_score']].sort_values('radar_score', ascending=False).head(10)
The weighting is intentionally straightforward:
Radar Score =
40% earnings proximity
35% recent volatility
25% absolute 30-day move
We keep EPS estimate in the final output as context, but we do not use it in the score. In this run, most candidates already had estimates available, so it did not help separate the rankings.
Now we can quickly inspect the top-ranked names:

At this point, we have a ranked earnings list. The next step is to make the output easier to read by adding one short reason for why each stock appears in the radar.
Create the Final Top 10 Earnings Radar
The score gives us the ranking, but the table still needs one more thing: a short explanation for each stock.
This makes the output easier to scan. A reader should be able to look at the table and quickly understand why a company was flagged.
def explain_radar_row(row):
    high_vol = row['volatility_30d'] >= radar['volatility_30d'].quantile(0.75)
    big_move = row['abs_return_30d'] >= radar['abs_return_30d'].quantile(0.75)
    very_close = row['days_to_report'] <= 2
    within_week = row['days_to_report'] <= 7

    if very_close and high_vol and big_move:
        if row['return_30d'] > 0:
            return 'Near-term report with strong pre-earnings momentum'
        return 'Near-term report after a sharp pre-earnings selloff'

    if very_close and high_vol:
        return 'Near-term report with elevated market activity'

    if within_week and high_vol:
        return 'Upcoming report with high recent volatility'

    if big_move:
        if row['return_30d'] > 0:
            return 'Large 30D rally heading into earnings'
        return 'Large 30D decline heading into earnings'

    if very_close:
        return 'Earnings report due very soon'

    if pd.notna(row['estimate']):
        return 'Upcoming report with EPS estimate available'

    return 'Upcoming S&P 500 earnings event'

radar['why_it_matters'] = radar.apply(explain_radar_row, axis=1)
radar['return_30d'] = (radar['return_30d'] * 100).round(2)
radar['volatility_30d'] = (radar['volatility_30d'] * 100).round(2)

radar[['Ticker','Name','report_date','days_to_report','return_30d',
       'volatility_30d','radar_score','why_it_matters']].sort_values('radar_score', ascending=False).head(10).reset_index(drop=True)
The function does not affect the score. It only turns the strongest signals into a readable label.
This is the final radar output:

A higher score means the stock is reporting soon, has shown elevated volatility, or has already made a meaningful move before earnings. It does not mean the company is likely to beat or miss estimates.
In this run, names like Applied Materials, Axon, Trade Desk, Palo Alto Networks, Synopsys, and Dell surfaced because they combined upcoming earnings with active recent price behavior. That is exactly what the radar is meant to do: reduce a crowded earnings calendar into a smaller watchlist worth checking first.
How Teams and Traders Can Use This
For financial media teams, this radar can work as a daily earnings coverage filter. Instead of starting with a long calendar, editors can quickly see which S&P 500 reports have the most pre-earnings activity and decide where to focus previews, charts, alerts, or post-earnings follow-ups.
For fintech products, the same logic can power earnings widgets, watchlists, or notification systems. A product does not need to show every upcoming report with the same priority. It can highlight the names where timing and market behavior suggest higher user interest.
For individual traders and developers, this works as a simple pre-earnings watchlist. It does not replace deeper research, but it gives a cleaner starting point than manually scanning dozens of earnings dates.
Conclusion
The goal of this build was not to predict earnings surprises. It was to reduce a crowded earnings calendar into a smaller, explainable list of stocks worth checking first.
Using EODHD’s earnings calendar, S&P 500 components, and historical price data, we created a lightweight radar that ranks upcoming reports by timing, recent volatility, and pre-earnings price movement.
From here, the script can be adapted into a daily content workflow, a product feature, or a personal earnings watchlist. The core idea stays the same: start with the full earnings calendar, then use data to decide what deserves attention first.
With that being said, you’ve reached the end of the article. Hope you learned something new and useful. Thank you for your time.


Comments