Using AI + Dividends to Manage Risk
- Nikhil Adithyan

- Jan 8, 2024
- 5 min read
A practical case-study using Python and APIs

Introduction
Figuring out the risks before they happen is the best way to go, just like the saying “prevention is better than cure.” Risk management is itself a very vast and interesting topic that needs investors' utmost attention. Everybody wants to take calculated risks. In this process of calculating the risk, we are here with a solution to further ease the process using the Financial Modeling Prep (FMP) API. We are using the dividend historical endpoint along with the other comprehensive endpoints of the FMP API to assess the risk of investment in a stock.
What is a dividend? It is a sum of money paid regularly (typically annually) by a company to its shareholders out of its profits (or reserves) and an important indicator of classifying risk on a stock. Let’s dive in now to make the problem easier with artificial intelligence.
Importing the necessary packages
In this section, we will get to know all the tools that will help us form a system for accessing the risks involved.
# Import necessary libraries

import pandas as pd
import requests
from sklearn.model_selection import train_test_split
from xgboost import XGBClassifier
from sklearn.metrics import accuracy_score, classification_report, confusion_matrix
Pandas is a powerful data manipulation and analysis library, particularly for working with structured data through DataFrames.
Requests simplify HTTP requests, commonly used for retrieving data from web APIs.
sklearn.model_selection (import train_test_split) is a part of scikit-learn that facilitates the essential task of splitting datasets into training and testing sets.
xgboost implements models, including the xgboost classifier, for predictive modeling tasks.
sklearn.metrics provides metrics for evaluating machine learning models, with mean squared error measuring the average squared difference between predicted and actual values.
Data retrieval and preparation
In this section, we will fetch various data from different endpoints of the Financial Modeling Prep API, including the Dividend Historical, Statement Analysis, and Income Statement. We will extract the important columns from them, merge them, and modify them to form the correct dataset for our needs.
Dividend payments are a key indicator of a company’s financial health and stability. Investors often rely on consistent and growing dividend payments as a sign of a company’s profitability and long-term viability. Assessing dividend risk helps investors identify potential pitfalls and make more informed decisions about their investments.
We will access this data from the Financial Modeling Prep API.
api_key = 'YOUR_API_KEY'

# Fetch historical dividend data
url = f"https://financialmodelingprep.com/api/v3/historical-price-full/stock_dividend/AAPL?apikey={api_key}"
response = requests.get(url)
data = response.json()

# Extract relevant data from the API response
df_dividends = pd.DataFrame(data['historical'])

df_dividends

The code fetches historical dividend data using the FMP API. Make sure to replace YOUR API KEY with your secret API key which you can obtain after registering an FMP developer account. The data includes dates, dividend amounts, and other relevant details.
# Fetch Statement Analysis
url = f"https://financialmodelingprep.com/api/v3/key-metrics/AAPL?period=quater&apikey={api_key}"
response = requests.get(url)
data = response.json()

# Extract relevant data from the API response
df_statement_analysis = pd.DataFrame(data)

df_statement_analysis

The data obtained contains the statement analysis of a company and is essential for evaluating a company’s financial health, profitability, and overall performance, providing valuable insights into its operational efficiency and strategic standing in the market.
# Fetch Income Statement
url = f"https://financialmodelingprep.com/api/v3/income-statement/AAPL?period=quater&apikey={api_key}"
response = requests.get(url)
data = response.json()

# Extract relevant data from the API response
df_income_statement = pd.DataFrame(data)

df_income_statement.head(5)

The income_statement endpoint in the Financial Modeling Prep API delivers detailed information about a company’s income statement, including revenue, expenses, and net profit.
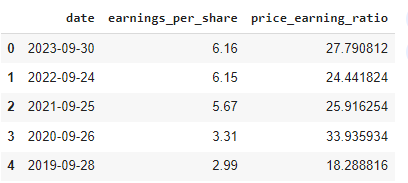
We are now extracting the relevant features from the obtained data to assess the risk of a stock. We chose earning per share and profit-to-earnings ratio as the two parameters; you can use more to form a more robust system.
df_financial = pd.DataFrame()
df_financial['date'] =  df_statement_analysis['date']
df_financial['earnings_per_share'] = df_income_statement['eps']
df_financial['price_earning_ratio'] = df_statement_analysis['peRatio']

df_financial.head(5)
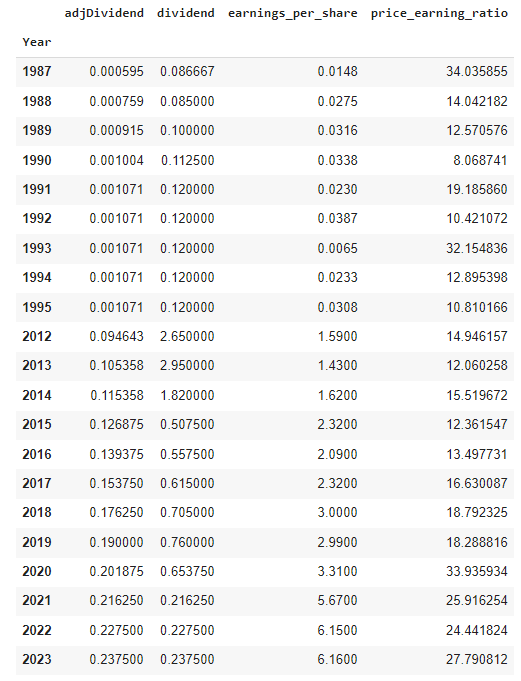
We merged the financial data with the dividend data annually to get the mean score for each year using the following:
# Convert the 'Date' column to datetime format
df_dividends['date'] = pd.to_datetime(df_dividends['date'])
# Extract the year from the 'Date' column
df_dividends['Year'] = df_dividends['date'].dt.year
# Group by year and calculate the mean for each column
dividends_yearly = df_dividends.groupby('Year').mean()

# Convert the 'Date' column to datetime format
df_financial['date'] = pd.to_datetime(df_financial['date'])
# Extract the year from the 'Date' column
df_financial['Year'] = df_financial['date'].dt.year

# Merge dividend data with financial metrics data based on the date
merged_yearly = pd.merge(dividends_yearly, df_financial, left_on="Year", right_on="Year", how="left")
merged_yearly
Financial metrics are used to create additional features, such as the dividend payout ratio and dividend coverage ratio. These features contribute to the assessment of a company’s financial stability.
Dividend Payout Ratio:
It reveals the percentage of a company’s earnings distributed as dividends, helping investors gauge how much profit is returned to shareholders.
Dividend Coverage Ratio:
This metric assesses a company’s ability to cover dividend payments with earnings, showing how many times the earnings can support the dividends.
# Fill missing financial metric values with 0 (assuming no data on those days)
merged_yearly.fillna(0, inplace=True)

# Feature engineering: Calculate additional financial ratios or use existing ones
# For simplicity, we'll use the earnings per share and price-to-earnings ratio
merged_yearly["dividend_payout_ratio"] = merged_yearly["dividend"] / merged_yearly["earnings_per_share"]
merged_yearly["dividend_coverage_ratio"] = 1 / merged_yearly["price_earning_ratio"]

merged_yearly

A risk label is assigned based on predefined thresholds for financial metrics. If a company surpasses these thresholds, it is labeled as high risk (1); otherwise, it is labeled as low risk (0).
price_earning_threshold = 15  # Example threshold, adjust as needed
dividend_payout_threshold = 5  # Example threshold, adjust as needed
dividend_coverage_threshold = 0.1  # Example threshold, adjust as needed

# Create a target variable 'risk'
merged_yearly['risk'] = (
    (merged_yearly['price_earning_ratio'] > price_earning_threshold) &
    (merged_yearly['dividend_payout_ratio'] > dividend_payout_threshold) &
    (merged_yearly['dividend_coverage_ratio'] < dividend_coverage_threshold)
).astype(int)

merged_yearly = merged_yearly.drop('date',axis =1)
merged_yearly = merged_yearly.set_index('Year')
merged_yearly

Training the model and making predictions
In this section, we utilized the XGBoost Classifier to train the model using the classified data from the preceding section. The data is categorized as either low risk or high risk for investment based on specific thresholds. The model is subsequently evaluated using metrics such as accuracy, confusion matrix, and classification report.
X = merged_yearly.drop('risk', axis=1)
y = merged_yearly['risk']

# Train-test split
X_train, X_test, y_train, y_test = train_test_split(X, y, test_size=0.2, random_state=42)

# Train an XGBoost classifier
xgb_classifier = XGBClassifier()
xgb_classifier.fit(X_train, y_train)
The trained model is now used for predictions of risk for certain stock data and is evaluated using metrics.
# Make predictions on the test set
y_pred = xgb_classifier.predict(X_test)

# Evaluate the classifier
accuracy = accuracy_score(y_test, y_pred)
conf_matrix = confusion_matrix(y_test, y_pred)
classification_rep = classification_report(y_test, y_pred)

print(f'Accuracy: {accuracy:.2f}')
print(f'Confusion Matrix:\n{conf_matrix}')
print(f'Classification Report:\n{classification_rep}')

Given the limited size of our dataset, the test data is also constrained. A review of the confusion matrix reveals that the model accurately predicts 4 out of 5 low-risk stocks (0) but misclassifies one as a high-risk stock.
A classification report, a performance evaluation metric in machine learning, furnishes a summary of positives and negatives. In our scenario, the low-risk class is predicted more accurately than the high-risk class due to the dataset imbalance, leading to an accuracy of 0.80.
Conclusion
Assessing dividend risk is a crucial aspect of intelligent investing. This article provides a foundation for constructing a dividend risk assessment model, incorporating historical dividend data and financial metrics obtained from the Financial Modeling Prep API — a remarkable source of vast data.
Investors can leverage such models to make more informed decisions, optimize their portfolios, and navigate the dynamic stock market landscape with increased confidence. As is the case with any financial model, continuous refinement and adaptation are essential to ensuring its relevance and effectiveness in ever-changing market conditions.
With that being said, you’ve reached the end of the article. Hope you learned something new and useful today. Thank you very much for your time.


Comments